Interactive map
Colima Map
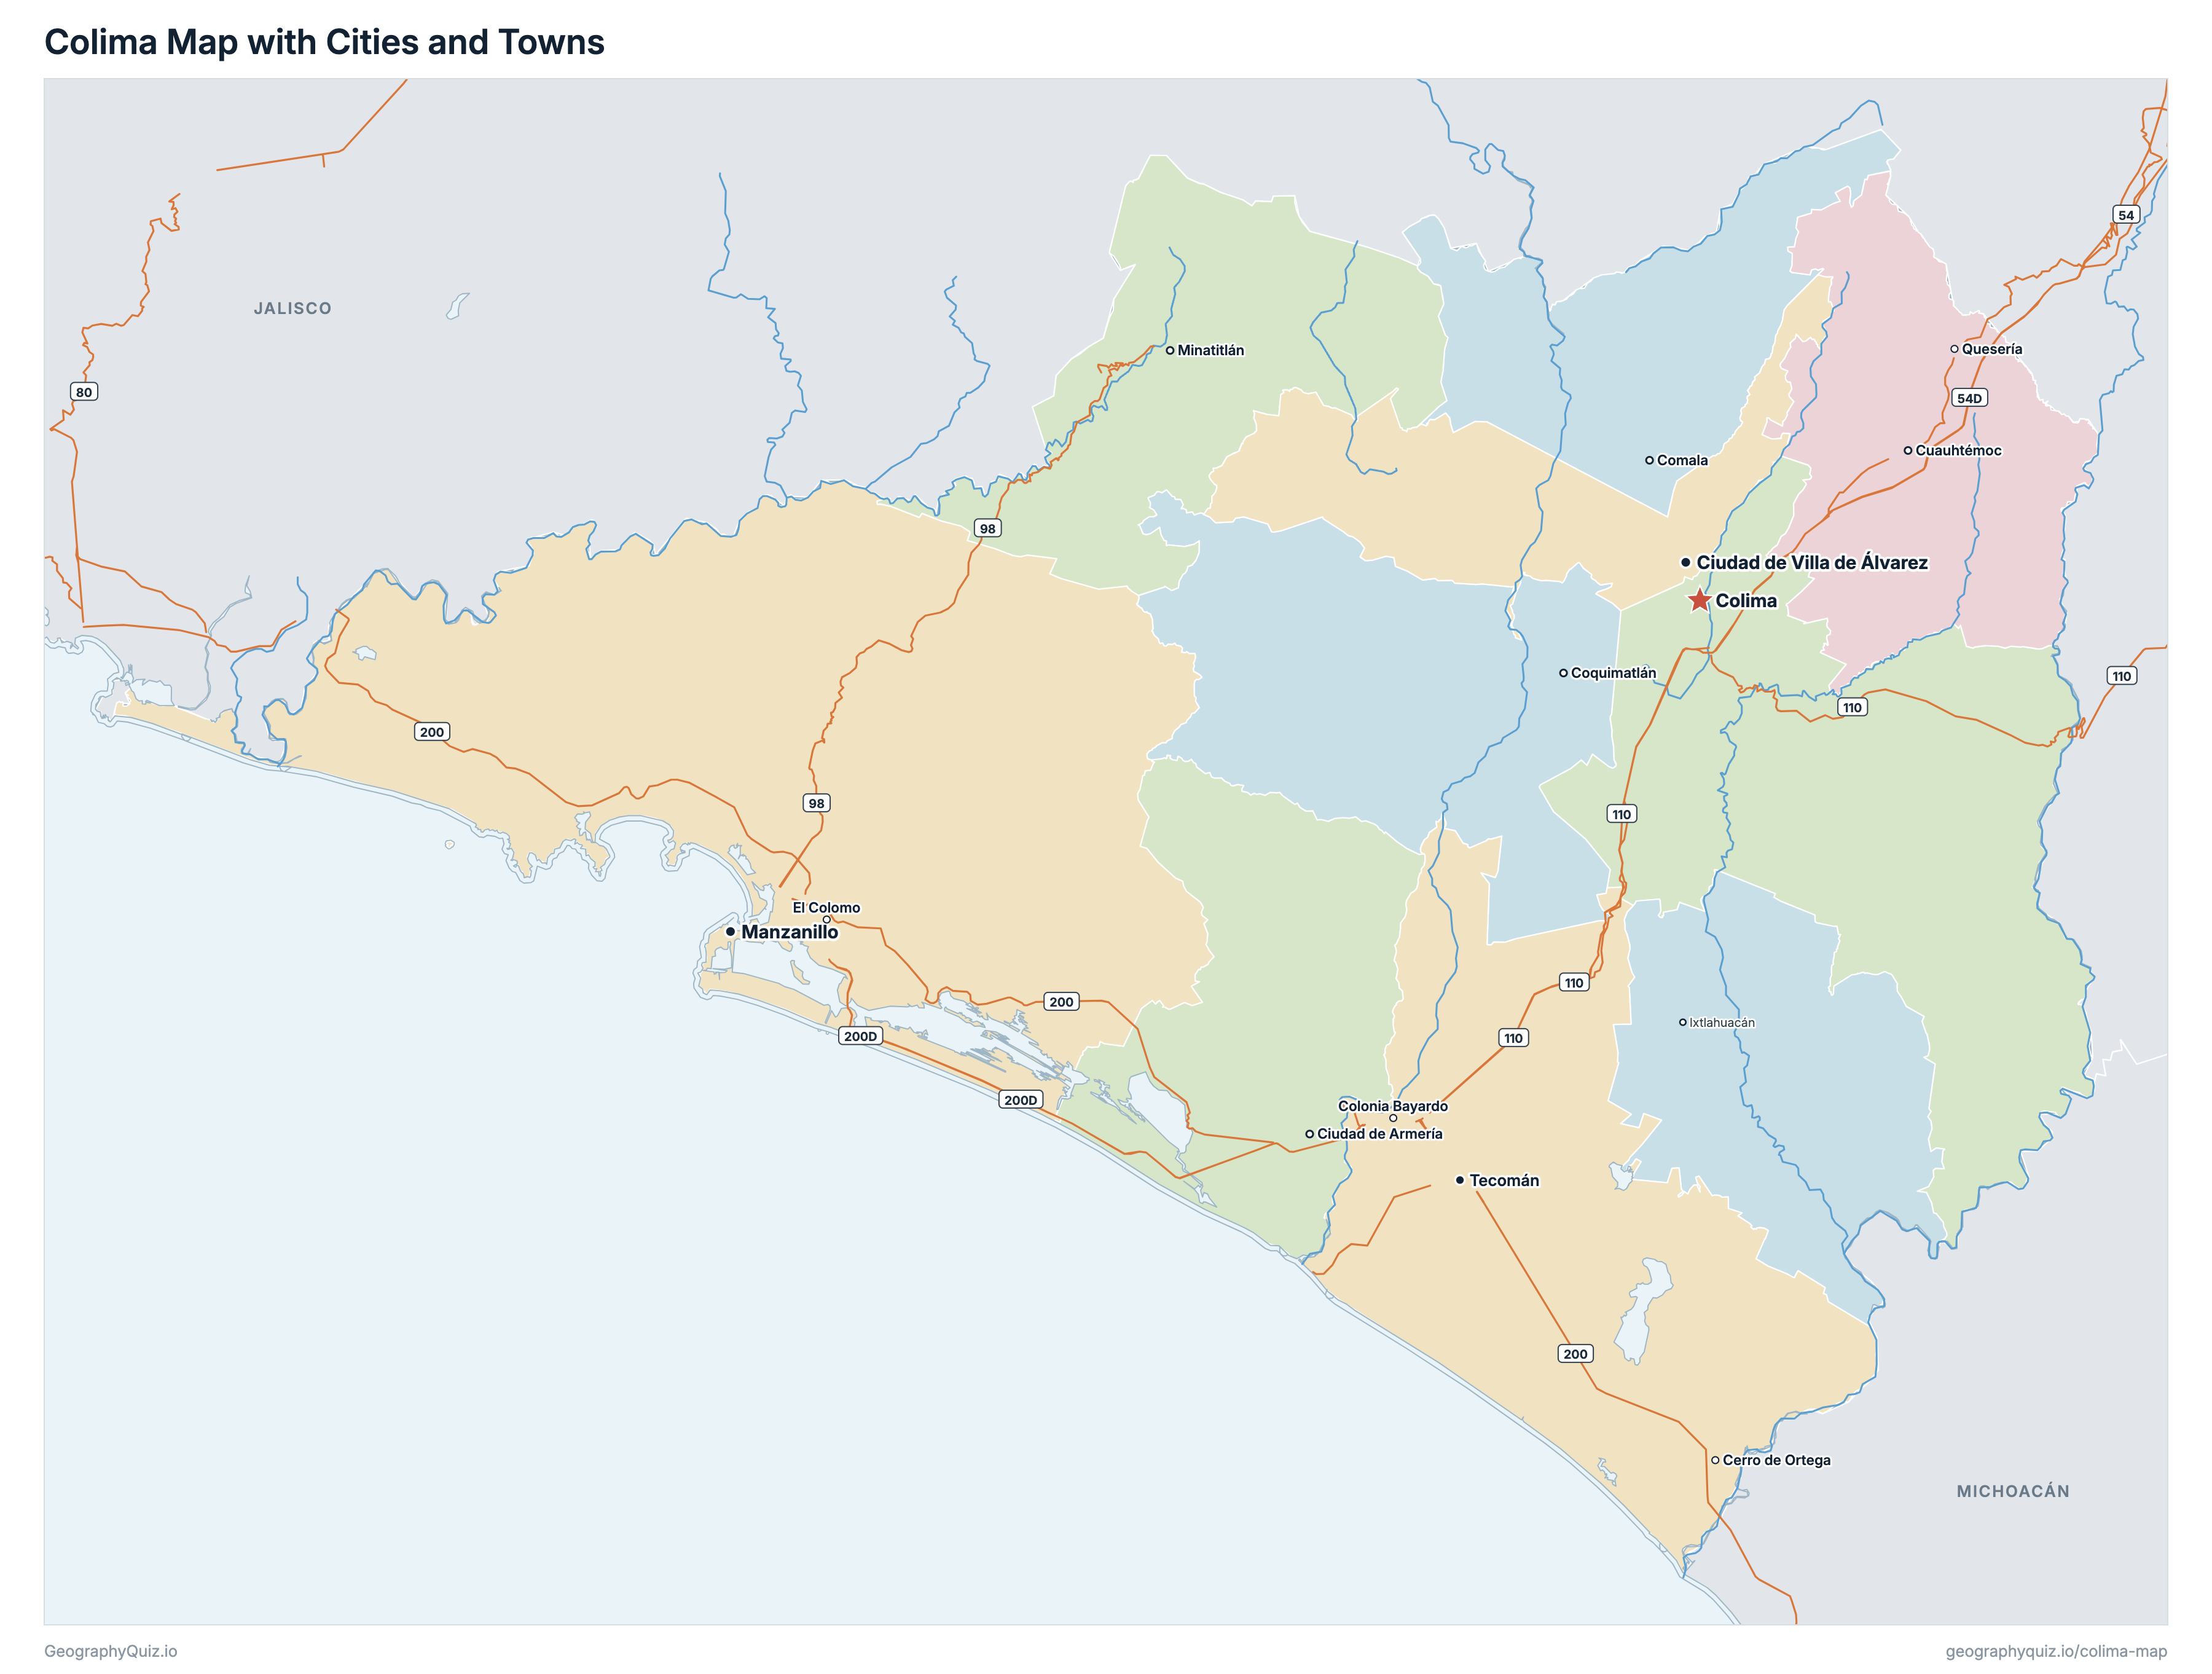
Every municipality, city and town in Colima on one zoomable map, with its main highways, rivers and lakes. Switch on towns and municipalities above the map and zoom in for every name; tap a municipality to see its population, area and largest towns.
Loading the map…
Printable maps of Colima
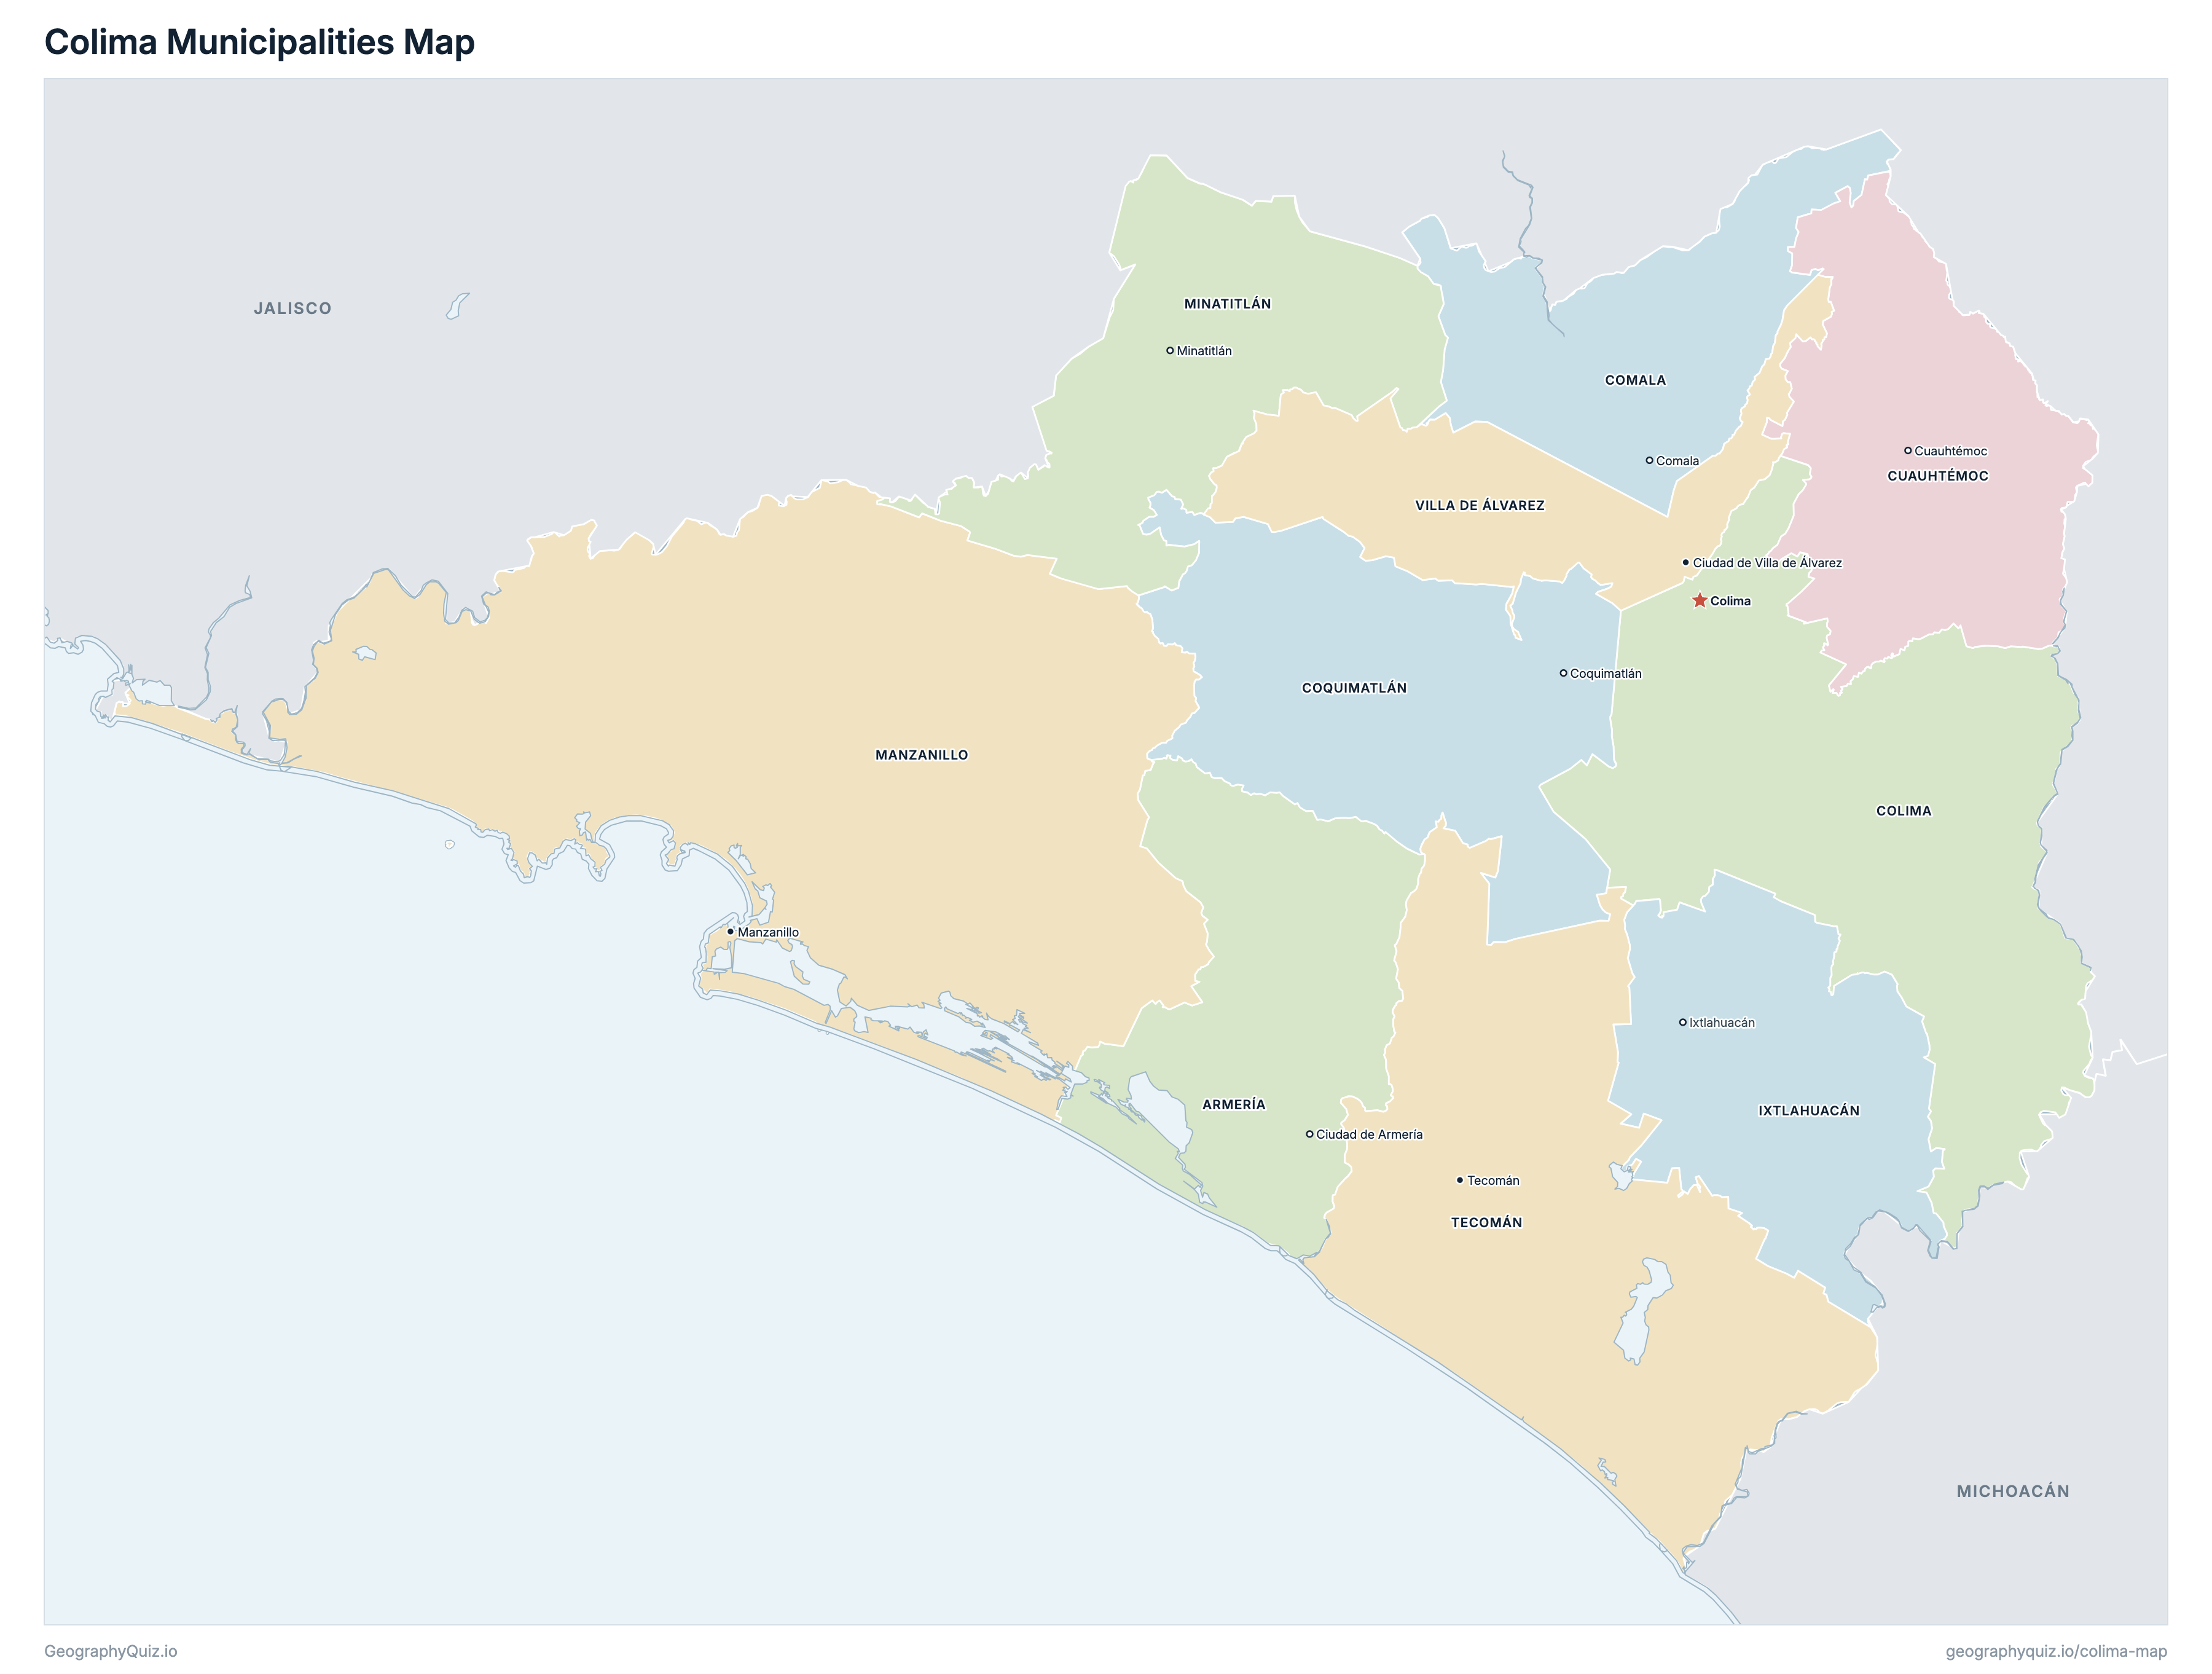
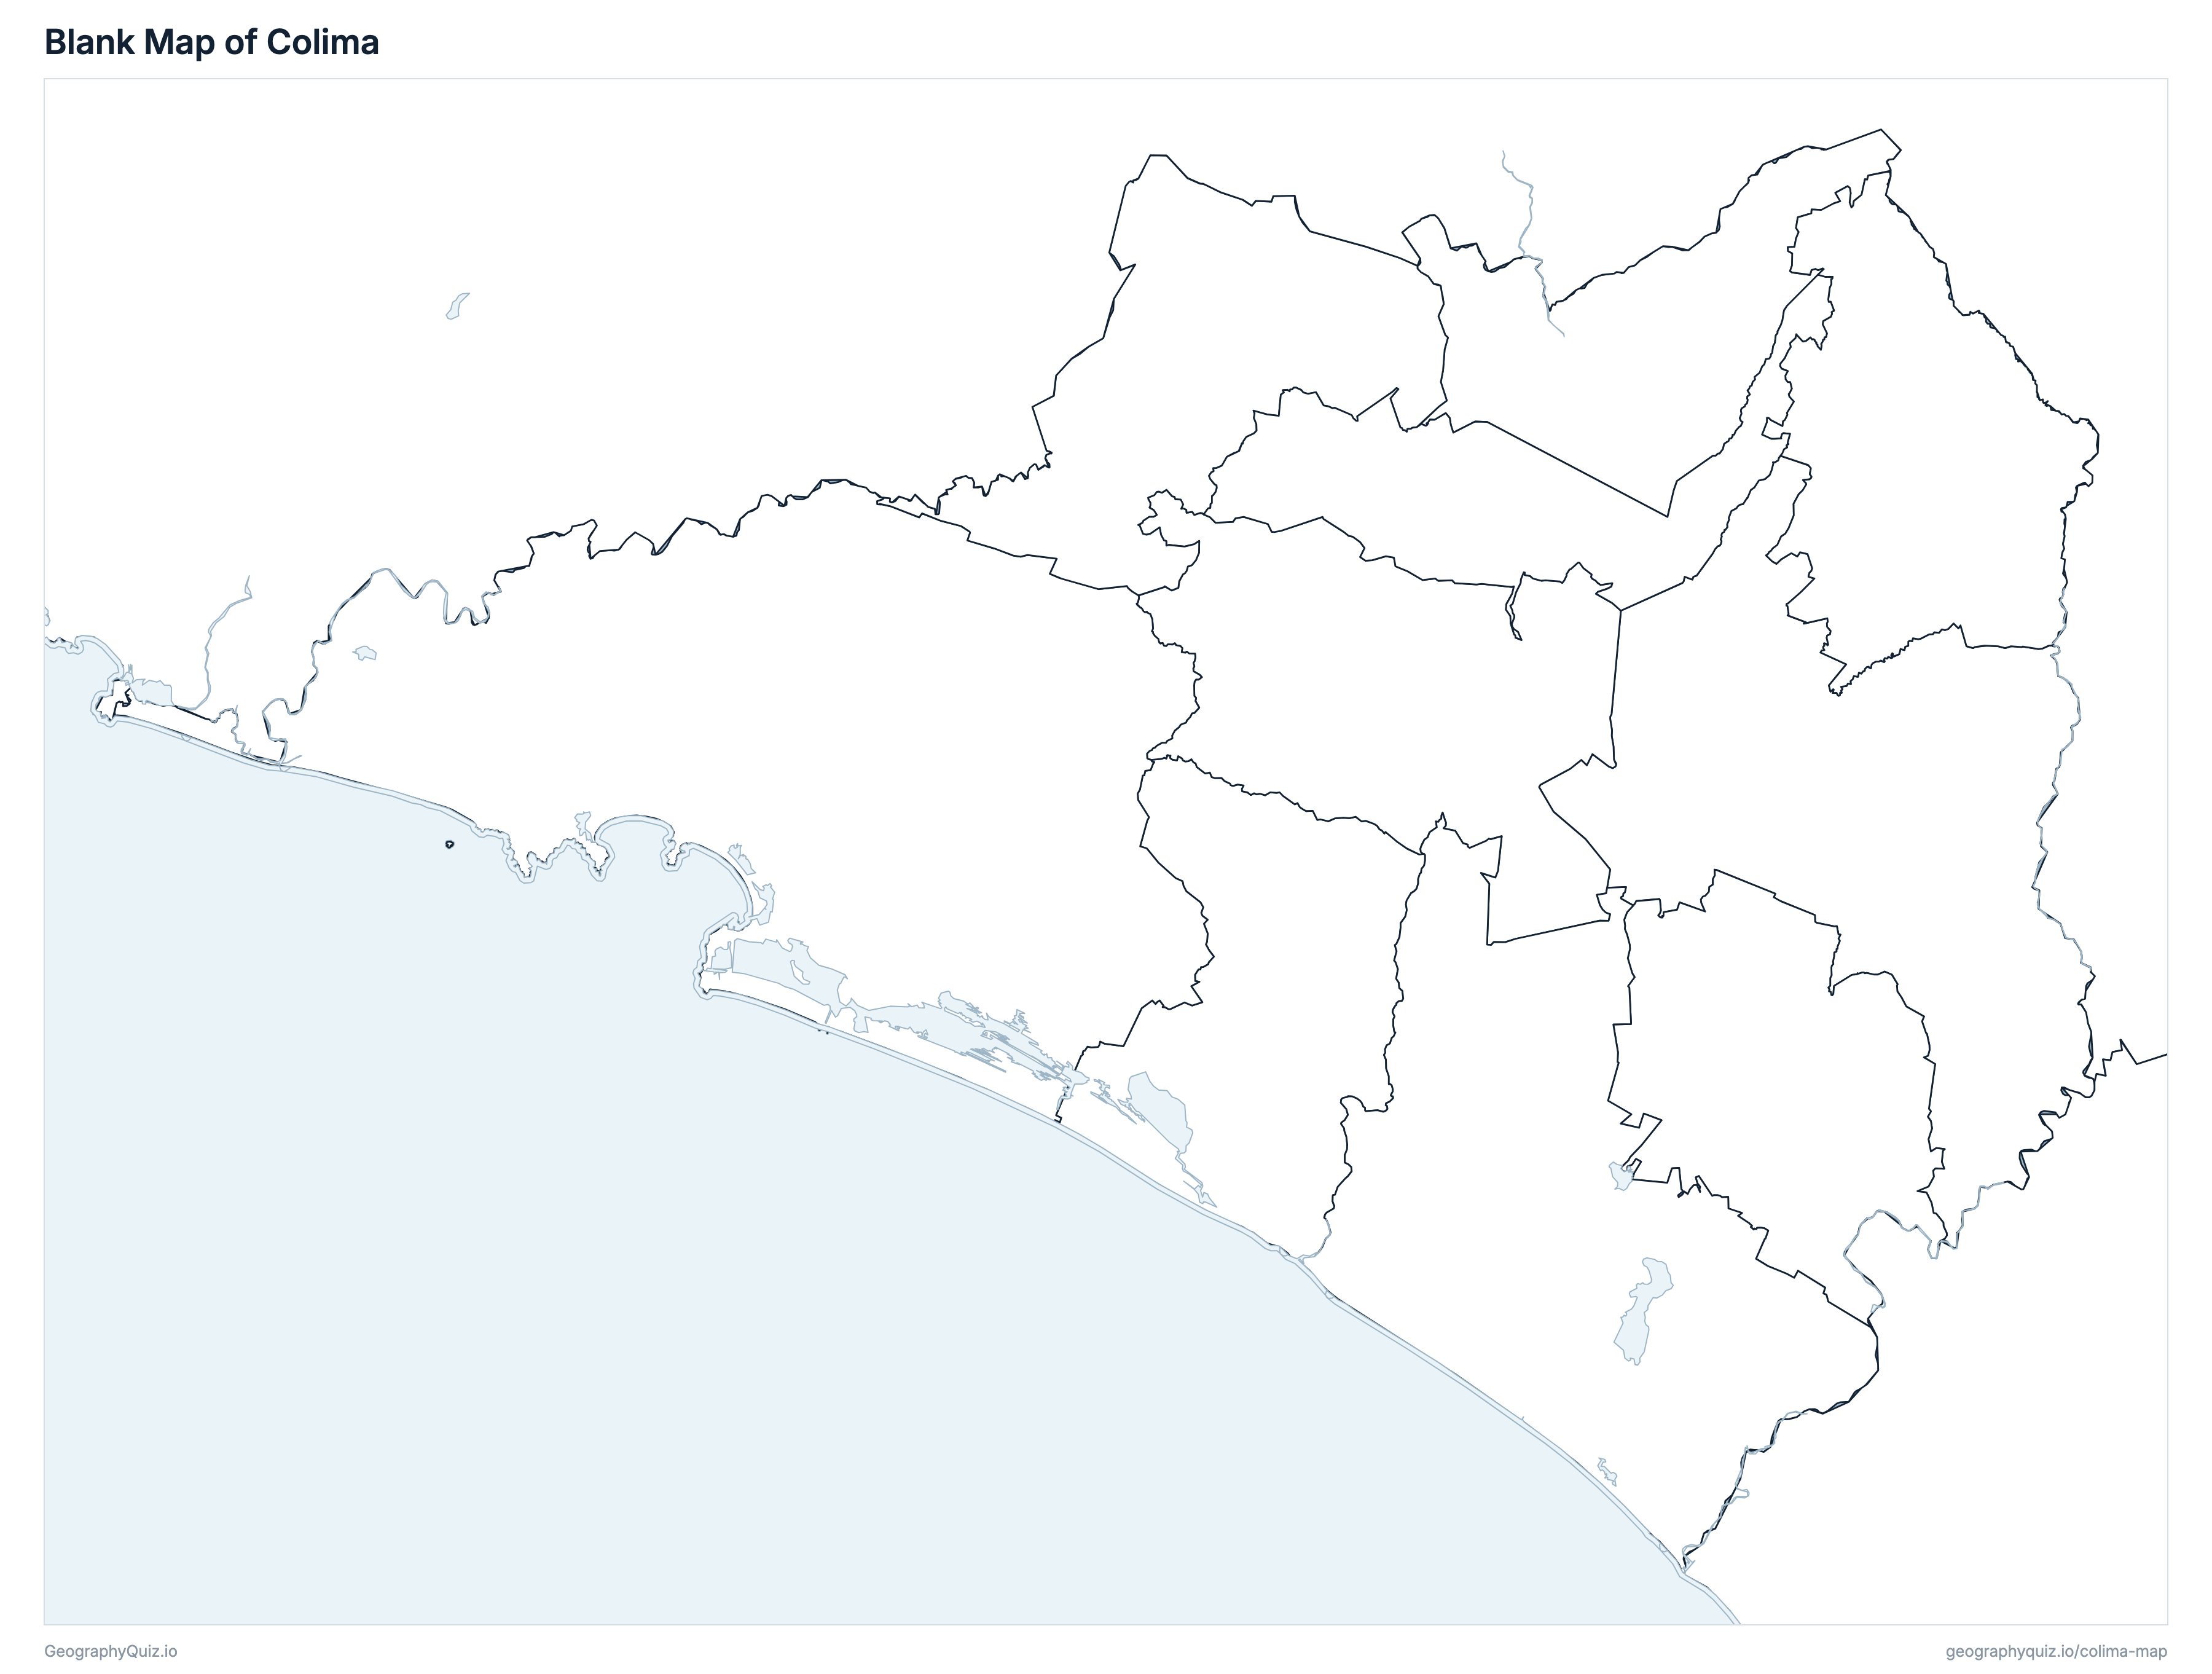
Free to print for class and home: Colima with its cities and towns, a map of its municipalities, and a blank outline map. PDFs fit one A4 or US Letter page.
Colima map with cities
Colima municipalities map
Key facts
- Capital
- Colima
- Largest city
- Manzanillo (159,853)
- Population
- 758,987 (2025)
- Area
- 5,783 km² (2,233 sq mi)
- Municipalities of Colima
- 10
- Most populous municipality
- Manzanillo (205,802)
- Largest municipality by area
- Manzanillo, 1,386 km² (535 sq mi)
About Colima
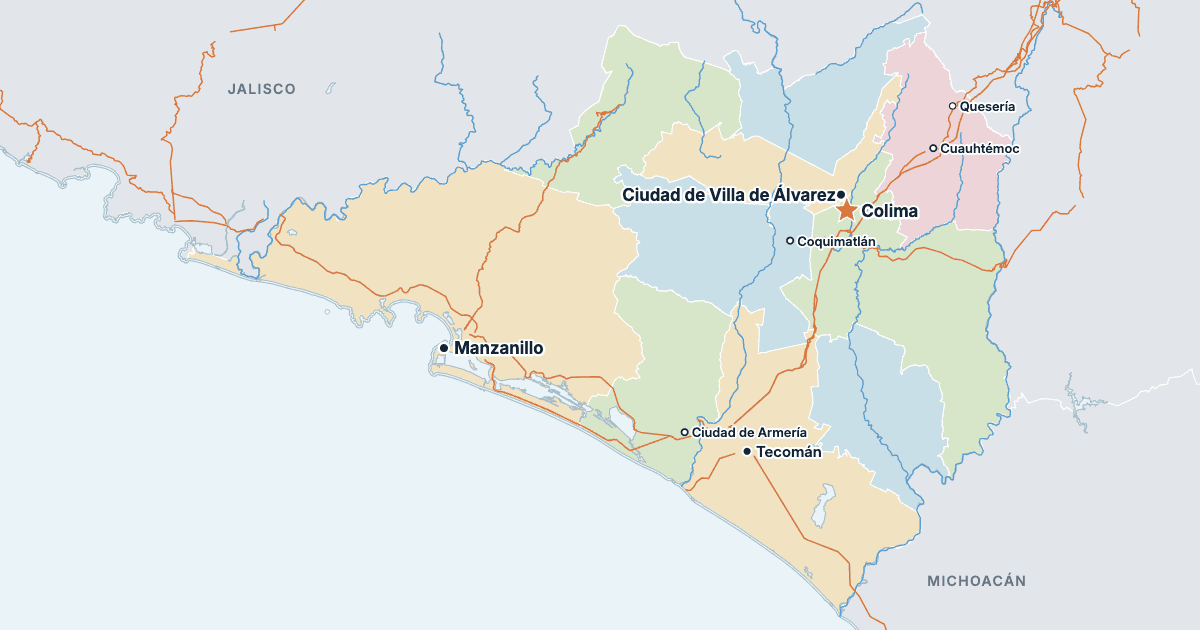
Colima has 10 municipalities and about 758,987 people (2025) on 5,783 km² (2,233 sq mi). The capital is Colima; the largest city is Manzanillo, with 159,853 people (2020). It borders Jalisco and Michoacán.
Manzanillo is the most populous municipality (205,802 people) and Ixtlahuacán the least (5,303); Manzanillo is the largest by area (1,386 km²) and Villa de Álvarez the smallest (287 km²).
Largest cities in Colima
The 14 most populous cities and towns. All 14 are on the map above: switch on Towns and zoom in to see them.
| # | City | Municipality | Population |
|---|---|---|---|
| 1 | Manzanillo | Manzanillo | 159,853 |
| 2 | Ciudad de Villa de Álvarez | Villa de Álvarez | 147,496 |
| 3 | Colima | Colima | 146,965 |
| 4 | Tecomán | Tecomán | 88,337 |
| 5 | Ciudad de Armería | Armería | 15,368 |
| 6 | Coquimatlán | Coquimatlán | 14,892 |
| 7 | Quesería | Cuauhtémoc | 9,931 |
| 8 | Cuauhtémoc | Cuauhtémoc | 9,746 |
| 9 | El Colomo | Manzanillo | 9,664 |
| 10 | Comala | Comala | 9,649 |
| 11 | Cerro de Ortega | Tecomán | 9,309 |
| 12 | Minatitlán | Minatitlán | 6,075 |
| 13 | Colonia Bayardo | Tecomán | 5,393 |
| 14 | Ixtlahuacán | Ixtlahuacán | 2,985 |
Populations are INEGI's Encuesta Intercensal 2025 estimates for 15 October 2025 of the people living in private dwellings; the 10 municipalities add up to the state's 758,987. The state's total on the Mexico map, 762,212, also counts the 3,225 people INEGI estimates in collective dwellings and without a dwelling, which it publishes only for the whole state. Towns are INEGI's localities with their 2020 Census population: every municipal seat and every other locality of 5,000 people or more.
Municipalities of Colima
All 10 municipalities. Select one to show it on the map.
| Ciudad de Armería | 25,628 | 419 | |
| Colima | 163,222 | 745 | |
| Comala | 21,743 | 314 | |
| Coquimatlán | 21,361 | 500 | |
| Cuauhtémoc | 31,136 | 412 | |
| Ixtlahuacán | 5,303 | 377 | |
| Manzanillo | 205,802 | 1,386 | |
| Minatitlán | 11,587 | 415 | |
| Tecomán | 117,565 | 928 | |
| Ciudad de Villa de Álvarez | 155,640 | 287 |
Quizzes and worksheets
Sources
- Municipalities and states: INEGI (Instituto Nacional de Estadística y Geografía), Marco Geoestadístico of the Encuesta Intercensal 2025; areas measured from these boundaries.
- Populations: INEGI, Encuesta Intercensal 2025, population in private dwellings by municipality at 15 October 2025 (main results by locality, open data); the state's total population: INEGI, Encuesta Intercensal 2025.
- Towns and municipal seats: INEGI, Catálogo Único de Claves de Áreas Geoestadísticas Estatales, Municipales y Localidades (AGEEML), with each locality's population in the Censo de Población y Vivienda 2020.
- Federal highways: INEGI, Red Nacional de Caminos 2025 (with the SICT and the Mexican Institute of Transportation).
- Rivers: INEGI, Red Hidrográfica Digital de México 1:250 000, edition 1.0; lakes and reservoirs: INEGI, Red Hidrográfica 1:50 000, edition 2.0.