US weather · interactive map
Tornado Alley Map
Tornado Alley is the band of the central Plains where tornadoes are most frequent: Texas, Oklahoma, Kansas, Nebraska, South Dakota and Iowa, with Dixie Alley across the Southeast from Arkansas to Alabama and Tennessee. Every dot on this map is a half-degree square, about 30 miles across, sized and colored by how many tornadoes touched down there from 1950 to 2025: 73,458 in all. Hover over or tap a state for its numbers.
- Tornado Alley (traditional core)
- Dixie Alley
Tornado Alley and Dixie Alley have no official borders: these are the states most often included. Dots: tornado touchdowns 1950–2025 per half-degree square (about 30 miles across), darker and larger where there were more. Florida's many dots are mostly weak tornadoes and waterspouts that came ashore.
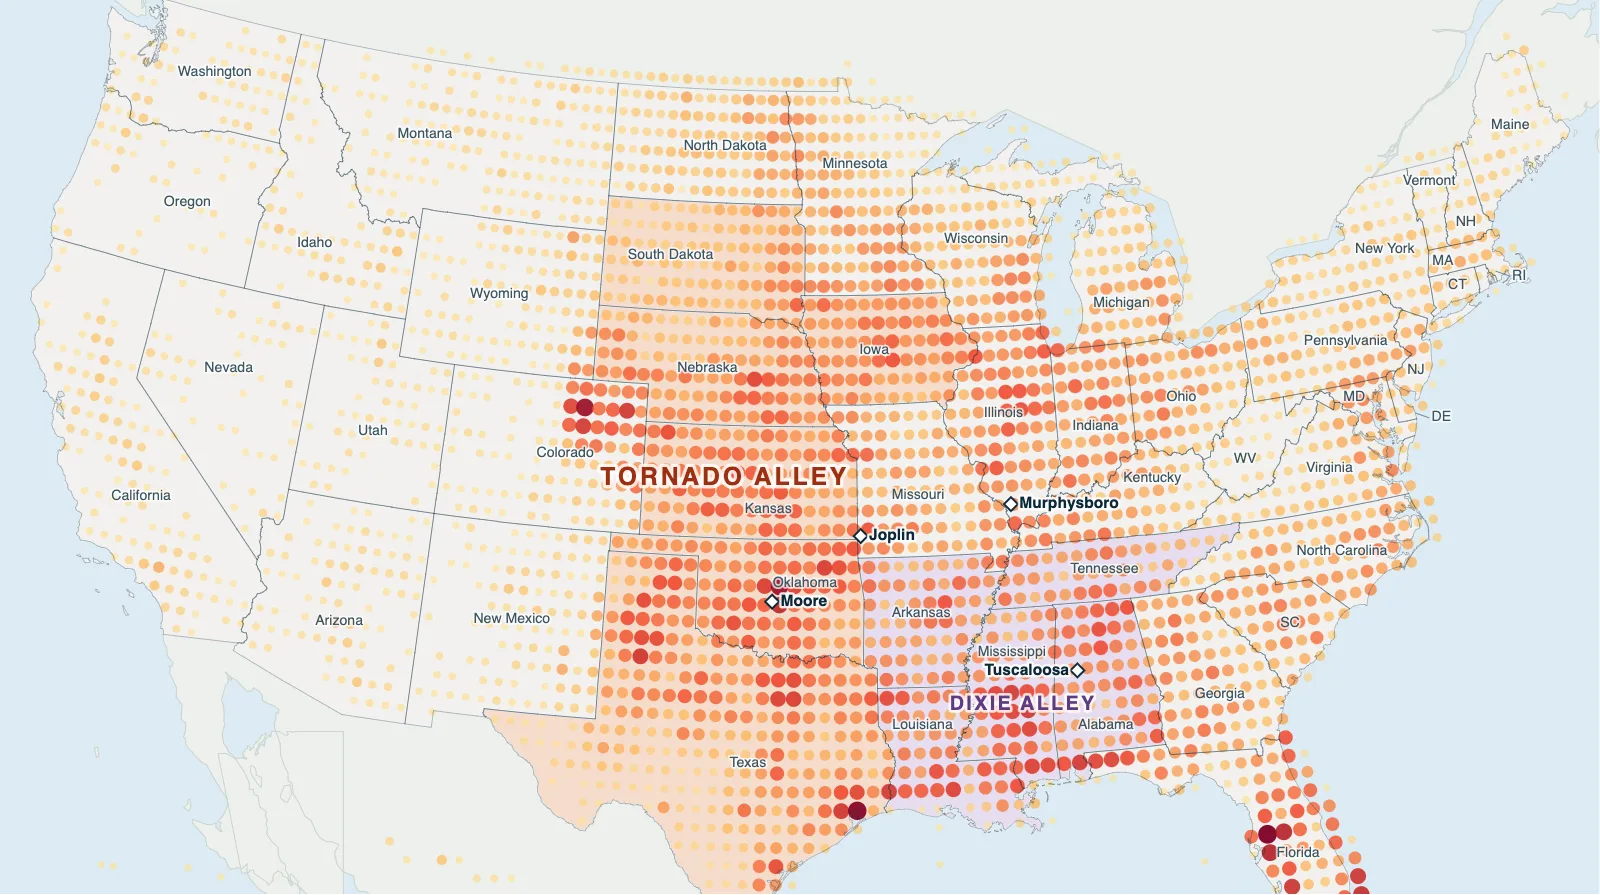
Hover over or tap a state, line or place for details.
Test yourself on this map
Find US States on the Map · Click each state we name
Printable Tornado Alley Map
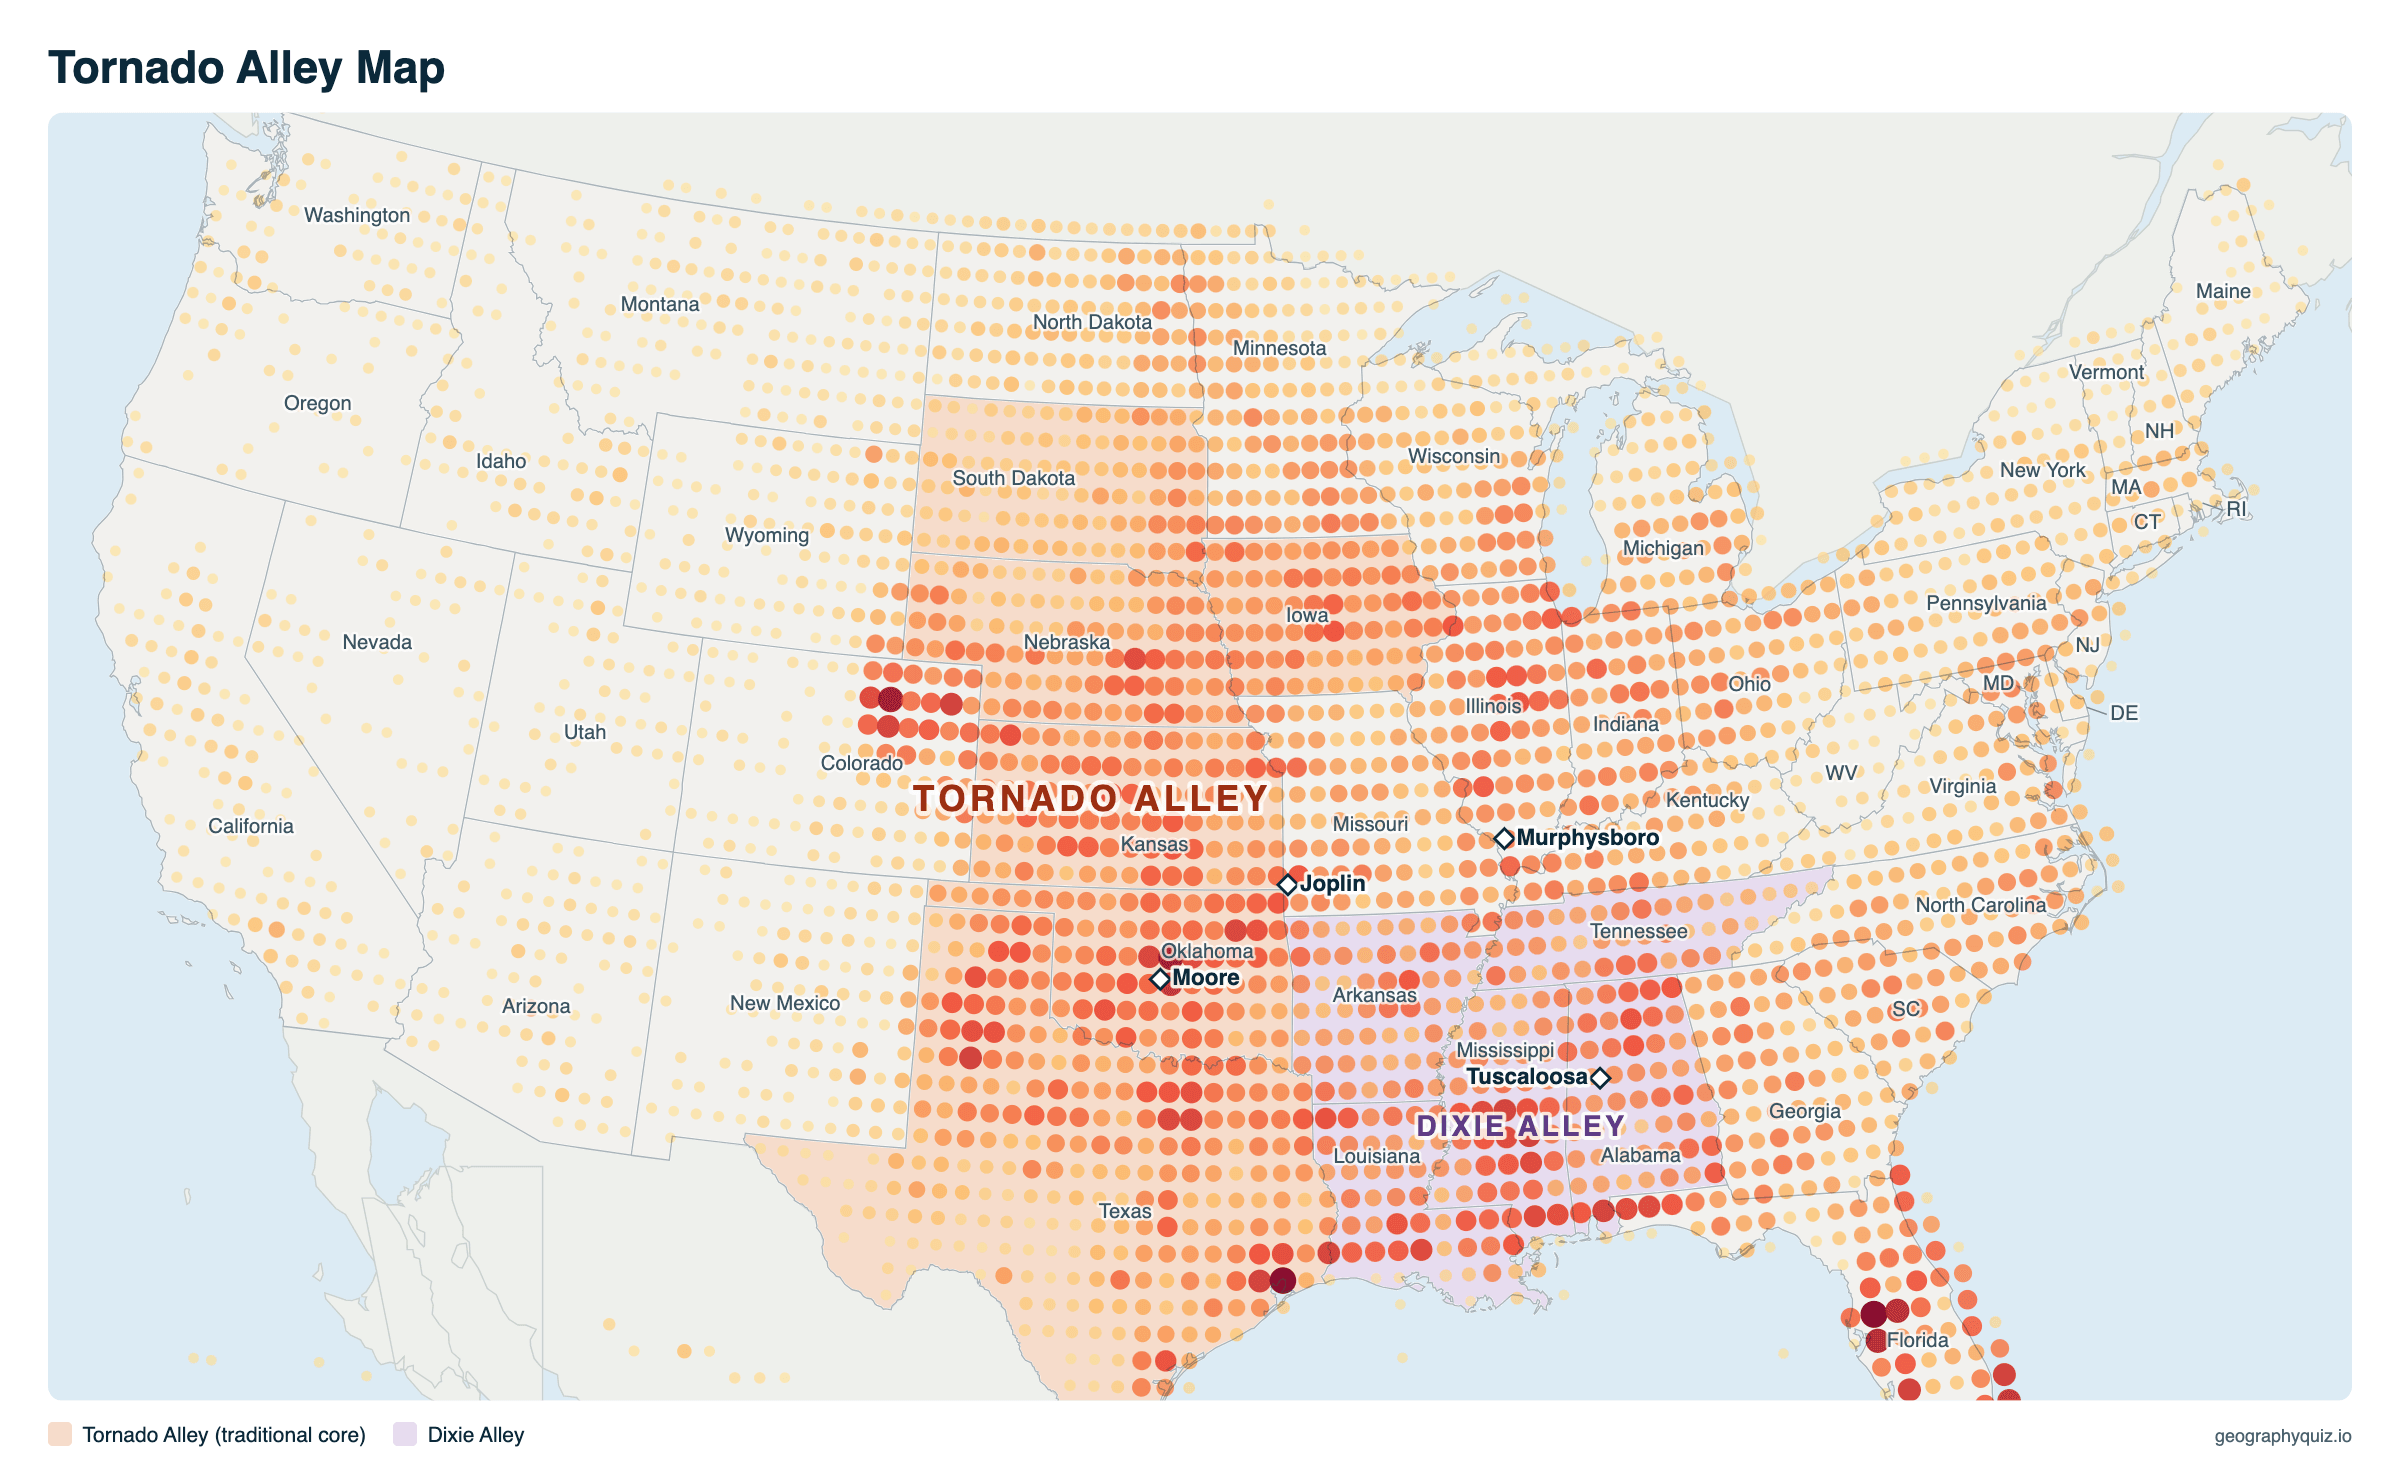
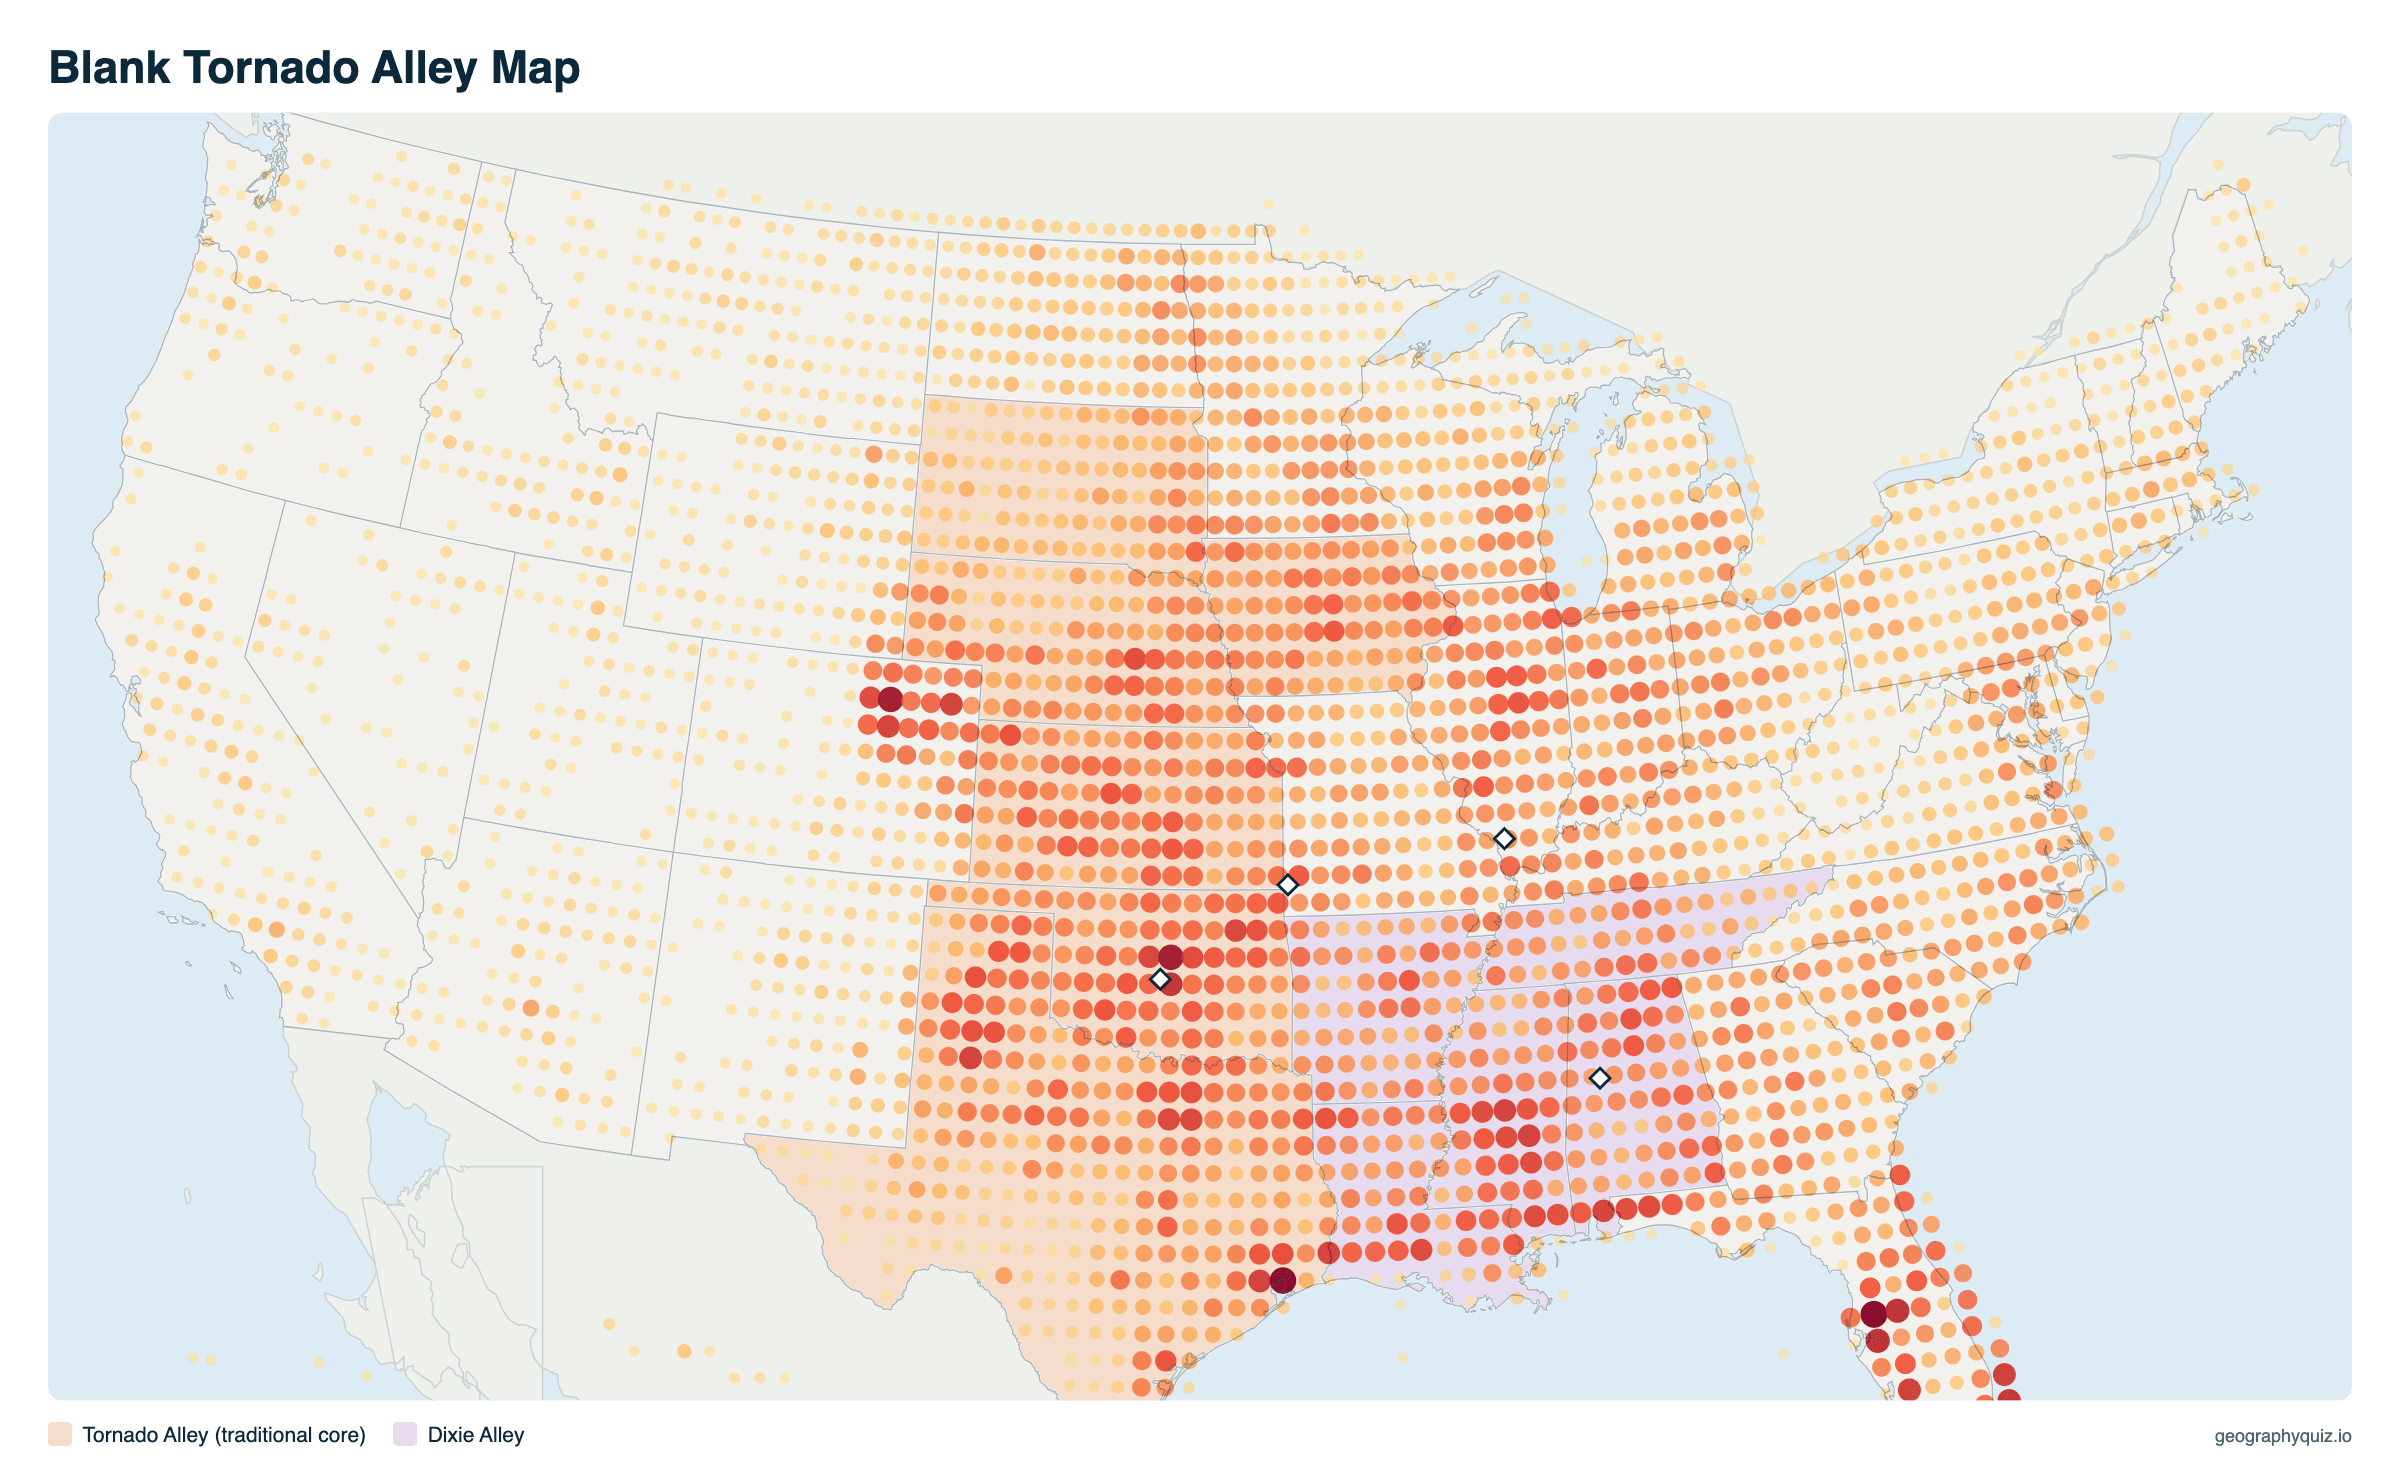
Free to print for class and home: tornado touchdowns 1950–2025 with Tornado Alley and Dixie Alley, on one landscape A4 or US Letter page. The blank version leaves out the names, so students can label the states and the two alleys. The blank version has the same map with no names on it, for labeling in class.
Key facts
- Tornadoes a year (US)
- About 1,268 (1996–2025 average), more than any other country
- Most tornadoes
- Texas, about 130 a year
- Most for their size
- Mississippi, Alabama and Illinois: about 12–13 a year per 10,000 sq mi of land
- Most deaths since 1950
- Alabama (682), then Texas (593)
- Peak season
- April to June (54% of all tornadoes); March to May and November in the Southeast
- Deadliest tornado
- Tri-State Tornado, March 18, 1925: 695 deaths in Missouri, Illinois and Indiana
- Recorded 1950–2025
- 73,458 tornadoes; 656 rated F4/EF4 or EF5
Tornadoes by state
All 50 states, from the most tornadoes a year (1996–2025 average) to the fewest, with tornadoes per 10,000 square miles of land, and totals, violent tornadoes and deaths since 1950. A tornado that crosses a state line counts in each state it touches, with the deaths in each state.
| # | State | Per year | Per 10,000 sq mi | Since 1950 | F4/EF4+ | Deaths |
|---|---|---|---|---|---|---|
| 1 | Texas | 129.9 | 5.0 | 9,617 | 55 | 593 |
| 2 | Kansas | 80.9 | 9.9 | 4,610 | 50 | 238 |
| 3 | Oklahoma | 71.3 | 10.4 | 4,516 | 69 | 360 |
| 4 | Illinois | 64.5 | 11.6 | 3,149 | 34 | 235 |
| 5 | Mississippi | 60.0 | 12.8 | 2,883 | 38 | 533 |
| 6 | Alabama | 59.9 | 11.8 | 2,721 | 43 | 682 |
| 7 | Iowa | 56.1 | 10.0 | 3,099 | 54 | 98 |
| 8 | Florida | 55.3 | 10.3 | 3,762 | 2 | 174 |
| 9 | Nebraska | 50.8 | 6.6 | 3,223 | 35 | 56 |
| 10 | Missouri | 50.2 | 7.3 | 2,707 | 43 | 423 |
| 11 | Louisiana | 45.5 | 10.5 | 2,503 | 9 | 179 |
| 12 | Minnesota | 45.0 | 5.7 | 2,216 | 27 | 100 |
| 13 | Colorado | 43.9 | 4.2 | 2,479 | 1 | 5 |
| 14 | Arkansas | 42.3 | 8.1 | 2,146 | 30 | 415 |
| 15 | Georgia | 36.8 | 6.4 | 2,014 | 11 | 227 |
| 16 | Tennessee | 31.3 | 7.6 | 1,479 | 35 | 405 |
| 17 | North Carolina | 31.1 | 6.4 | 1,551 | 12 | 134 |
| 18 | North Dakota | 30.9 | 4.5 | 1,739 | 14 | 29 |
| 19 | Indiana | 28.9 | 8.1 | 1,763 | 33 | 274 |
| 20 | Kentucky | 28.6 | 7.2 | 1,261 | 23 | 242 |
| 21 | South Dakota | 26.9 | 3.5 | 1,956 | 10 | 19 |
| 22 | Wisconsin | 25.6 | 4.7 | 1,618 | 21 | 101 |
| 23 | Ohio | 24.9 | 6.1 | 1,402 | 23 | 199 |
| 24 | South Carolina | 24.9 | 8.3 | 1,225 | 11 | 66 |
| 25 | Virginia | 18.2 | 4.6 | 835 | 2 | 38 |
| 26 | Pennsylvania | 17.9 | 4.0 | 993 | 9 | 85 |
| 27 | Michigan | 14.3 | 2.5 | 1,152 | 19 | 247 |
| 28 | Wyoming | 10.2 | 1.1 | 750 | 1 | 4 |
| 29 | New York | 9.4 | 2.0 | 536 | 3 | 31 |
| 30 | New Mexico | 9.3 | 0.8 | 679 | 0 | 4 |
| 31 | California | 8.8 | 0.6 | 486 | 0 | 0 |
| 32 | Maryland | 8.5 | 8.8 | 425 | 2 | 9 |
| 33 | Montana | 6.4 | 0.4 | 444 | 1 | 4 |
| 34 | Arizona | 4.8 | 0.4 | 303 | 0 | 3 |
| 35 | Idaho | 3.4 | 0.4 | 226 | 0 | 0 |
| 36 | West Virginia | 3.1 | 1.3 | 177 | 0 | 3 |
| 37 | Oregon | 2.9 | 0.3 | 136 | 0 | 0 |
| 38 | Washington | 2.7 | 0.4 | 136 | 0 | 6 |
| 39 | New Jersey | 2.5 | 3.4 | 193 | 0 | 1 |
| 40 | Massachusetts | 2.2 | 2.8 | 200 | 3 | 109 |
| 41 | Connecticut | 2.1 | 4.3 | 127 | 2 | 4 |
| 42 | Utah | 2.1 | 0.3 | 142 | 0 | 1 |
| 43 | Maine | 1.8 | 0.6 | 136 | 0 | 1 |
| 44 | Nevada | 1.6 | 0.1 | 97 | 0 | 0 |
| 45 | New Hampshire | 0.9 | 1.0 | 101 | 0 | 1 |
| 46 | Delaware | 0.8 | 4.1 | 77 | 0 | 3 |
| 47 | Vermont | 0.6 | 0.7 | 50 | 0 | 0 |
| 48 | Hawaii | 0.5 | 0.8 | 41 | 0 | 0 |
| 49 | Rhode Island | 0.4 | 3.9 | 20 | 0 | 0 |
| 50 | Alaska | 0.1 | 0.0 | 5 | 0 | 0 |
Why are there so many tornadoes in Tornado Alley?
In spring, warm, humid air flows north from the Gulf of Mexico at ground level, while dry air from the deserts of the Southwest and cold air from Canada or the Rockies arrive above it. Where they meet over the flat Great Plains, the air is unstable and the winds change speed and direction with height, the ingredients for supercell thunderstorms, which spawn the strongest tornadoes. Nowhere else on Earth brings them together as often, which is why the United States has far more tornadoes than any other country.
Tornado Alley's season peaks from April to June and moves north as spring turns to summer. Dixie Alley, across Arkansas, Louisiana, Mississippi, Alabama and Tennessee, has fewer tornadoes than the Plains but a higher share of deadly ones: they often come at night, in fall and winter as well as spring, hidden by rain and trees, and many people live in mobile homes.
The name dates from 1952, when two Air Force meteorologists, Major Ernest Fawbush and Captain Robert Miller, used "Tornado Alley" as the title of a study of severe weather in Texas and Oklahoma. NOAA treats it as an informal nickname, not an official region with fixed borders.
Is Tornado Alley moving east?
Partly. Comparing two 30-year periods of the same records, the six core Tornado Alley states had 39% of US tornadoes in 1966–1995 and 33% in 1996–2025, while the five Dixie Alley states went from 13% to 19%. For tornadoes rated EF2 or stronger, the ones that do serious damage, the change is bigger: the Plains core fell from 38% to 29% of the US total, and Dixie Alley rose from 20% to 29%.
Research by NOAA and university scientists has found the same eastward drift, toward the Mississippi and Tennessee valleys. Part of it is real, linked to changes in where warm, moist air and strong upper winds meet; part may come from better radar and reporting in the wooded Southeast. The Plains still get the most tornadoes, but the risk to people is now as high or higher in the Southeast, where more people live in the storms' path.
A tornado that crosses a state line counts in each state it touches, so the state shares are approximate.
Tornado season by month
US tornadoes by the month they touched down, 1950–2025. The peak moves north through the year: early spring on the Gulf Coast, May and early June on the southern Plains, June and July on the northern Plains and the upper Midwest.
| Month | Tornadoes | Share |
|---|---|---|
| January | 1,956 | 3% |
| February | 2,112 | 3% |
| March | 5,272 | 7% |
| April | 10,650 | 14% |
| May | 16,070 | 22% |
| June | 13,298 | 18% |
| July | 7,456 | 10% |
| August | 5,142 | 7% |
| September | 3,657 | 5% |
| October | 2,969 | 4% |
| November | 2,807 | 4% |
| December | 2,069 | 3% |
The Enhanced Fujita (EF) scale
US tornadoes are rated from the damage they cause. The Enhanced Fujita scale replaced the original Fujita scale on February 1, 2007. The last column is each rating's share of rated US tornadoes, 1996–2025 (F ratings before 2007).
| Rating | Estimated wind | Damage | Share |
|---|---|---|---|
| EF0 | 65–85 mph | Light: broken branches, shingles off | 56% |
| EF1 | 86–110 mph | Moderate: mobile homes overturned, windows broken | 32% |
| EF2 | 111–135 mph | Considerable: roofs torn off frame houses, large trees snapped | 9% |
| EF3 | 136–165 mph | Severe: whole stories of houses destroyed | 2% |
| EF4 | 166–200 mph | Devastating: well-built houses leveled | 0.4% |
| EF5 | Over 200 mph | Incredible: houses swept off their foundations | under 0.1% |
Frequently asked questions
What states are in Tornado Alley?
There is no official list. The classic Tornado Alley is the central Plains: Texas, Oklahoma, Kansas, Nebraska and South Dakota, often with Iowa, and sometimes Missouri, Colorado, Minnesota and North Dakota. Dixie Alley in the Southeast covers Arkansas, Louisiana, Mississippi, Alabama and Tennessee.
Where is Tornado Alley?
In the middle of the United States, on the Great Plains between the Rocky Mountains and the Mississippi Valley, from north Texas through Oklahoma, Kansas and Nebraska into South Dakota and Iowa. It is where warm, humid air from the Gulf of Mexico most often meets dry air from the West.
Which state has the most tornadoes?
Texas, with about 130 a year on average (1996–2025), because it is so large. Kansas (about 81) and Oklahoma (about 71) come next. For their size, Mississippi, Alabama and Illinois get the most, about 12–13 a year per 10,000 square miles of land.
Which place in Tornado Alley gets the most tornadoes?
Central Oklahoma. The half-degree squares around Oklahoma City, Moore and Norman have had more tornado touchdowns since 1950 than anywhere else in the Plains. Outside Tornado Alley, the Tampa Bay area of Florida and the Houston area have as many or more, but most of them are weak.
Which state has the most tornado deaths?
Alabama, with 682 deaths since 1950, more than Texas (593) with less than a third as many tornadoes. Mississippi (533) comes next. Dixie Alley's tornadoes are deadlier because they often strike at night and in the cool season, hidden by rain and trees.
How many tornadoes does the US get a year?
About 1,268 a year on average (1996–2025), more than any other country. Most are weak: more than half are rated EF0, and under 3% are EF3 or stronger.
When is tornado season?
On the Plains, April to June, peaking in May, the busiest month (22% of all US tornadoes since 1950). In the Southeast it starts earlier, from March, and has a second season in November, and tornadoes can strike there in any month.
What is Dixie Alley?
The region of the Southeast, around Arkansas, Louisiana, Mississippi, Alabama and Tennessee, with frequent and especially deadly tornadoes: they often strike at night, in the cool season, wrapped in rain, where many people live in mobile homes.
What is a mesocyclone?
The rotating updraft inside a supercell thunderstorm, usually a few miles across. Weather radar can spot it before a tornado forms; most strong tornadoes come from a mesocyclone, although most mesocyclones never produce one.
What should you do if a tornado warning is issued?
Go at once to a basement or storm shelter, or to a small interior room without windows on the lowest floor, and cover your head and neck; a mattress, blankets or a helmet add protection from flying debris. Mobile homes and cars offer little protection: leave them for a sturdy building if there is time.
What was the deadliest tornado in US history?
The Tri-State Tornado of March 18, 1925, which traveled more than 170 miles across Missouri, Illinois and Indiana and killed 695 people. The deadliest in recent decades was the Joplin, Missouri, EF5 tornado of May 22, 2011, which killed 158.
Sources
- Tornadoes: NOAA Storm Prediction Center, Severe Weather Database (1950–2025); averages are for 1996–2025; state counts include each state a tornado crossed, with the deaths in that state.
- Enhanced Fujita scale, tornado climatology and tornado safety: NOAA National Weather Service and Storm Prediction Center.
- Historic tornadoes: NOAA National Weather Service storm summaries (Tri-State Tornado 1925, Joplin 2011, Moore 1999 and 2013).
- State boundaries and land areas: US Census Bureau, cartographic boundary files (2024) and 2010 Census land areas.